¶ Monitoring Stack
¶ Overview
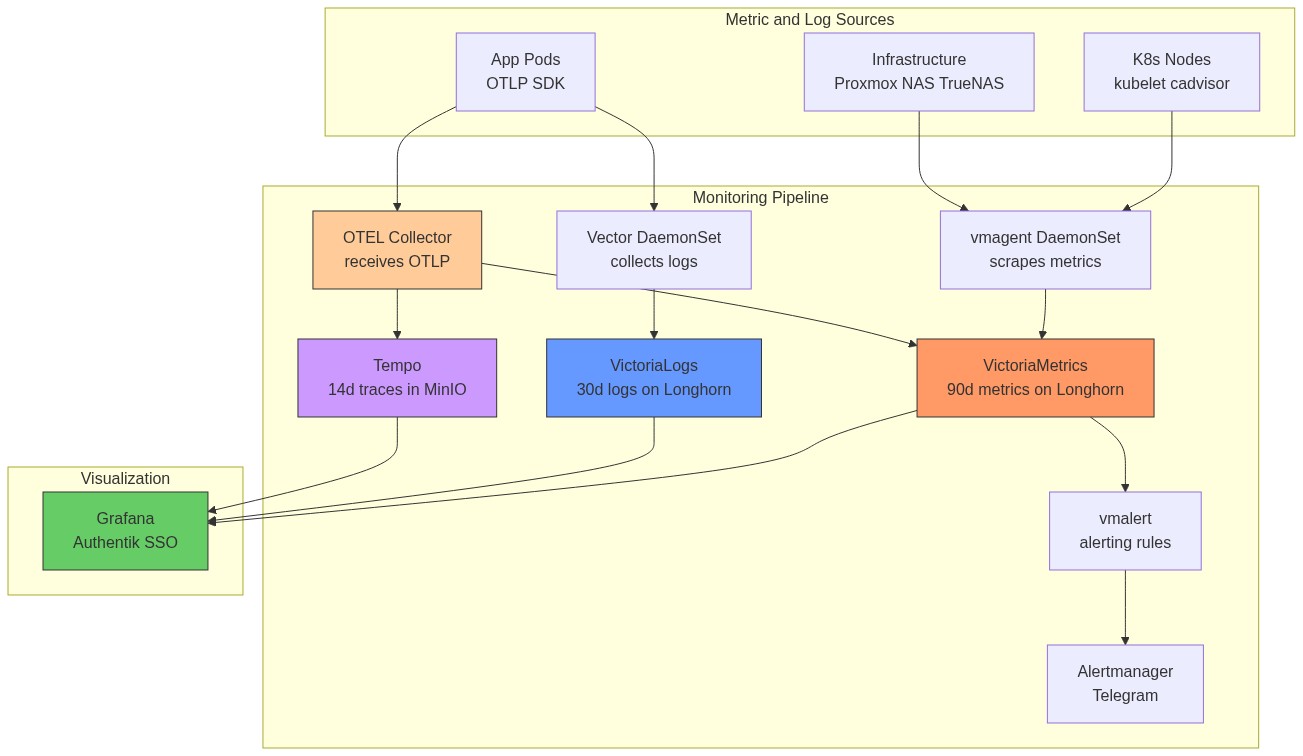
The monitoring stack is based on VictoriaMetrics (Prometheus-compatible, lower resource usage) with Grafana for visualization, vmalert for alerting, and VictoriaLogs + Vector for log aggregation. All components deploy at sync wave 11-12 into the monitoring namespace.
Why VictoriaMetrics instead of Prometheus?
VictoriaMetrics uses significantly less RAM and disk for the same data volume (often 5-10x more efficient). It is Prometheus-compatible (same PromQL query language, same /api/v1/query API), so Grafana dashboards and alert rules work without changes.
Why VictoriaLogs instead of Loki?
VictoriaLogs is simpler to operate (single binary, no object storage required at this scale), has lower resource usage, and the VictoriaLogs query language (LogQL-compatible subset) works with the Grafana VictoriaLogs datasource plugin.
Storage note: Both VictoriaMetrics and VictoriaLogs use Longhorn PVCs (15Gi each). They were migrated off TrueNAS NFS after INC-001 — monitoring must stay up during NFS outages to help diagnose the outage.
¶ Architecture
¶ How Metrics Flow (End-to-End)
¶ How Logs Flow (End-to-End)
MikroTik syslog path: MikroTik router → UDP syslog to MetalLB IP :514 → Vector syslog source → parsed BSD syslog fields → VictoriaLogs (tagged source: mikrotik).
¶ Component Details
¶ VictoriaMetrics (Time-Series Database)
VictoriaMetrics stores all scraped metrics. It accepts Prometheus remote write format from vmagent and serves PromQL queries to Grafana and vmalert.
How data is stored: VictoriaMetrics uses its own compressed columnar storage format. Each metric is stored as a time series (label set → sequence of timestamp/value pairs). It achieves high compression by delta-encoding timestamps and value differences, plus Gorilla-style XOR compression.
| Setting | Value |
|---|---|
| Chart | victoria-metrics-single v0.34.0 |
| Sync Wave | 11 |
| Storage | longhorn, 15Gi |
| Retention | 90 days |
| Resources | Requests: 100m CPU / 256Mi RAM, Limits: 1000m / 2Gi |
| Ingress | https://victoriametrics.homelab.vyanh.uk |
| Built-in Scraping | Disabled (vmagent handles all scraping) |
¶ vmagent (Metrics Collector)
vmagent is a lightweight metrics collector that scrapes Prometheus /metrics endpoints across the infrastructure and remote-writes to VictoriaMetrics. It runs as a DaemonSet — one pod per K8s node — so each node scrapes its local kubelet/cAdvisor without network hops to other nodes.
Why DaemonSet instead of a single Deployment? Kubelet metrics are only available on the local node's /metrics endpoint. A single pod would need to reach all nodes' kubelet ports, which may be restricted by NetworkPolicies. DaemonSet mode is more reliable and reduces cross-node traffic.
| Setting | Value |
|---|---|
| Chart | victoria-metrics-agent v0.35.0 |
| Sync Wave | 11 |
| Mode | DaemonSet (one pod per node) |
| Scrape Interval | 30s |
| Resources | Requests: 50m / 128Mi, Limits: 500m / 512Mi |
| Remote Write | http://victoria-metrics-...-server.monitoring:8428/api/v1/write |
Scrape Targets:
| Job | Target | What it measures |
|---|---|---|
kubelet |
K8s nodes :10250 | Pod lifecycle, volume stats, node conditions |
cadvisor |
K8s nodes :10250/metrics/cadvisor | Per-container CPU, RAM, network I/O |
kube-state-metrics |
In-cluster service | Deployment replicas, PVC status, pod phase |
node (K8s) |
K8s node IPs :9100 | Node CPU, RAM, disk, filesystem |
node (Synology) |
192.168.88.19:9100 | NAS CPU, RAM, disk usage |
node (pve1) |
192.168.88.100:9100 | Proxmox pve1 host resources |
node (pve2) |
192.168.88.101:9100 | Proxmox pve2 host resources |
node (pve3) |
192.168.88.102:9100 | Proxmox pve3 host resources |
| node (TrueNAS) | 192.168.88.230:9100 | Secondary NAS metrics |
| proxmox-pve | pve-exporter.monitoring K8s Deployment |
Proxmox VE API metrics (multi-target: pve1/pve2/pve3) |
| snmp-synology | 192.168.88.19:9116 | Synology SNMP (disk, RAID, temp) |
| snmp-mikrotik | 192.168.88.19:9116 target .88.1 | MikroTik SNMP via exporter on Synology NAS |
| technitium | Built-in web dashboard (no Prometheus endpoint) | DNS query stats via Technitium UI at dns.homelab.vyanh.uk |
¶ vmalert (Alerting)
vmalert periodically evaluates PromQL expressions against VictoriaMetrics. When a rule fires, it sends the alert to Alertmanager, which routes it to Telegram.
How alert routing works:
vmalert evaluates rule → fires → POST to Alertmanager
Alertmanager groups similar alerts → waits group_wait (30s) → sends to receiver
Receiver = ntfy webhook bridge → POST to https://ntfy.vyanh.uk/homelab-alerts
If alert still firing after repeat_interval → sends again
If alert resolves → sends "RESOLVED" message
Inhibit rules: A critical alert suppresses its corresponding warning alert. If CriticalCpuUsage fires, HighCpuUsage is silenced — avoiding duplicate ntfy spam.
| Setting | Value |
|---|---|
| Chart | victoria-metrics-alert v0.36.0 |
| Sync Wave | 11 |
| Evaluation Interval | 30 seconds |
| Alertmanager | Built-in Alertmanager (Telegram receiver) |
Alert Rules:
| Alert | Condition | for Duration |
Severity | What It Means |
|---|---|---|---|---|
| HighCpuUsage | CPU > 90% | 10m | warning | Node under sustained load |
| CriticalCpuUsage | CPU > 95% | 5m | critical | Node likely overloaded |
| HighMemoryUsage | Memory > 90% | 10m | warning | OOMKills may start |
| CriticalMemoryUsage | Memory > 95% | 5m | critical | OOMKills imminent |
| DiskSpaceLow | Disk > 90% | 15m | warning | PVC filling up |
| DiskSpaceCritical | Disk > 95% | 10m | critical | Pod will crash when full |
| PodCrashLooping | Restarts > 0 in 15m | 15m | warning | Pod is crashing repeatedly |
| NodeNotReady | Node Ready=false | 5m | critical | Node lost from cluster |
| PVCPending | PVC in Pending | 15m | warning | Storage provisioner failure |
| NodeExporterDown | up == 0 | 5m | critical | Node exporter unreachable |
| ProxmoxVMMemoryHigh | VM pve_memory_usage_bytes / pve_memory_size_bytes * 100 > 90 |
5m | warning | Proxmox VM using >90% of allocated RAM |
ProxmoxVMMemoryHigh note: The
idlabel uses Proxmox formatqemu/<vmid>(e.g.qemu/201for talos-worker1). The metric source is thepve-exporterK8s Deployment in themonitoringnamespace. Multi-target config scrapes pve1 (192.168.88.100), pve2 (.101), pve3 (.102) — alert selector usesinstance=~"pve1|pve2|pve3".
pve-exporter auth: Each Proxmox node (pve1/pve2/pve3) must have the
andy@pamuser with passwordDragonfab161093@. Set on each node:echo 'andy:Dragonfab161093@' | chpasswd.
Alertmanager Config:
- Route: All alerts →
ntfyreceiver - Repeat interval: 8h for warning, 1h for critical
- Inhibit: Critical suppresses matching warning for same
alertname+instance - ntfy: Bearer token from Vault (
kv/monitoring/alertmanager/ntfy), webhook receiver posts to homelab-alerts topic. URL: https://ntfy.vyanh.uk/homelab-alerts
Alert Runbooks:
ProxmoxVMMemoryHigh — VM RAM above 90%
- Identify the VM from the alert (
id=qemu/201→ VMID 201 = talos-worker1; 202 = worker2; 203 = worker3; 200 = cp1):kubectl top nodes # see actual node pressure kubectl describe node talos-worker1 | grep -A5 "Allocated resources" - Check what's consuming memory:
kubectl get pods -A --field-selector spec.nodeName=talos-worker1 \ -o custom-columns='NS:.metadata.namespace,NAME:.metadata.name,MEM:.spec.containers[*].resources.limits.memory' - Quick fix — offload workloads: Move monitoring storage off the overloaded node by adding
nodeSelectorto VictoriaMetrics/VictoriaLogs values. This alone can drop usage 5-10%. - Permanent fix — increase VM RAM: See Node RAM Upgrade Runbook below.
¶ Grafana (Dashboards)
Grafana is the single UI for all metrics and logs. It authenticates via Authentik OIDC — users log in with their Authentik account, no separate Grafana password needed.
How OIDC auth works:
- User clicks Login → Grafana redirects to Authentik
- Authentik authenticates the user (username/password or existing session)
- Authentik returns a JWT containing user email + group memberships
- Grafana maps Authentik groups to Grafana roles:
authentik Admins→ Grafana Admin
| Setting | Value |
|---|---|
| Chart | grafana v10.5.15 |
| Sync Wave | 11 |
| Storage | nfs-subdir-retain, 5Gi |
| URL | https://grafana.homelab.vyanh.uk |
| Auth | Authentik OIDC SSO |
| Admin credentials | Vault: kv/monitoring/grafana/admin (emergency local login only) |
Data Sources (auto-provisioned via ConfigMap):
| Source | Type | Internal Endpoint |
|---|---|---|
| VictoriaMetrics | Prometheus | victoria-metrics-...-server.monitoring:8428 |
| VictoriaLogs | VictoriaLogs | victoria-logs-...-server.monitoring:9428 |
| Tempo | Tempo | tempo.monitoring:3100 |
Tempo — cross-signal correlation:
The Tempo datasource links traces to other signals so you can jump between them in Grafana:
- Trace → Logs: trace ID opens matching VictoriaLogs entries
- Trace → Metrics:
nodeGraphview shows the service dependency map (derived by Tempo's metrics-generator pushing to VictoriaMetrics) - SpanBar: shows duration inline in the trace view
Dashboards (auto-provisioned via ConfigMap):
| Dashboard | Grafana ID | What to look at |
|---|---|---|
| Node Exporter Full | 1860 | CPU, RAM, disk I/O for all nodes + NAS |
| Proxmox VE | 10347 | VM CPU/RAM, Proxmox host health |
| Mikrotik | 14857 | Router interface traffic, CPU, memory |
| Synology NAS Details | 14284 | Disk health, RAID status, temperature |
| Kube-State-Metrics | 13332 | Pod health, deployment status, PVC states |
| VictoriaLogs Explorer | 22759 | Log search and analysis |
| Technitium | (built-in web UI) | DNS query rates, blocked domains, top clients — no Grafana dashboard needed |
¶ VictoriaLogs (Log Storage)
| Setting | Value |
|---|---|
| Chart | victoria-logs-single v0.11.30 |
| Sync Wave | 11 |
| Storage | longhorn, 15Gi |
| Retention | 30 days |
| Ingress | https://victorialogs.homelab.vyanh.uk |
¶ Vector (Log Collector)
| Setting | Value |
|---|---|
| Chart | vector v0.51.0 |
| Sync Wave | 11 |
| Mode | Agent (DaemonSet) |
| Resources | Requests: 50m / 128Mi, Limits: 500m / 512Mi |
Log Sources:
| Source | Type | Description |
|---|---|---|
| kubernetes_logs | K8s pod stdout | Auto-merges partial log lines |
| mikrotik_syslog | UDP:1514 | BSD syslog format from MikroTik router |
Transforms:
victorialogs_format— maps K8s logs to VictoriaLogs fields (_msg,_time,kubernetes.*,app,cluster)mikrotik_format— parses MikroTik syslog into structured fields (_msg,_time,topic,host,source: mikrotik)
Sink: HTTP POST to VictoriaLogs (JSON line format, batch: 10MB / 5s)
Syslog LoadBalancer: A dedicated service (syslog-service.yaml) exposes UDP port 514 via MetalLB for MikroTik syslog ingestion.
¶ kube-state-metrics
| Setting | Value |
|---|---|
| Chart | kube-state-metrics v7.2.2 |
| Sync Wave | 12 |
| Namespace | monitoring |
Provides metrics about K8s objects (pods, deployments, nodes, PVCs, etc.). Scraped by vmagent.
¶ metrics-server
| Setting | Value |
|---|---|
| Chart | metrics-server v3.13.0 |
| Sync Wave | 3 |
| Namespace | kube-system |
Provides node and pod resource metrics (CPU, memory) for kubectl top and Horizontal Pod Autoscaler.
¶ OpenTelemetry Collector (OTLP Hub)
The OpenTelemetry Collector is the central ingestion point for all OTLP telemetry from application pods. It fans out signals to the appropriate backend.
| Setting | Value |
|---|---|
| Chart | opentelemetry-collector v0.147.1 |
| Image | opentelemetry-collector-contrib (contrib distribution) |
| Sync Wave | 11 |
| Mode | Deployment (single pod) |
| Namespace | monitoring |
| Resources | Requests: 100m / 128Mi, Limits: 500m / 512Mi |
Signal routing:
Pipelines:
| Pipeline | Receivers | Processors | Exporters |
|---|---|---|---|
| Traces | otlp |
memory_limiter, batch |
otlp/tempo |
| Metrics | otlp |
memory_limiter, batch |
prometheusremotewrite |
| Logs | otlp |
memory_limiter, batch |
otlphttp/victorialogs |
Internal endpoint (for apps):
grpc: opentelemetry-collector.monitoring.svc.cluster.local:4317
http: opentelemetry-collector.monitoring.svc.cluster.local:4318
The memory_limiter processor (512 MiB limit) prevents the collector from OOMing if apps burst-send spans. The batch processor groups spans into 5-second batches before exporting.
¶ Tempo (Distributed Tracing)
Tempo stores distributed traces from application pods. It receives spans from the OpenTelemetry Collector and stores them durably in MinIO S3.
| Setting | Value |
|---|---|
| Chart | tempo v1.24.4 |
| Sync Wave | 11 |
| Namespace | monitoring |
| Retention | 14 days (336h) |
| Storage | MinIO S3 bucket tempo-traces (at 192.168.88.19:9000) |
| WAL | emptyDir (in-flight traces lost on crash only) |
| Ingress | https://tempo.homelab.vyanh.uk |
| Resources | Requests: 100m / 256Mi, Limits: 500m / 1Gi |
How Tempo stores traces:
Metrics Generator:
Tempo's built-in metrics-generator derives RED metrics (Rate, Error, Duration) and a service graph from trace spans. These are pushed to VictoriaMetrics so they appear in Grafana dashboards alongside regular Prometheus metrics.
Tempo metrics-generator → remote write → VictoriaMetrics
→ Grafana shows: request_rate, error_rate, p99_latency per service
→ Grafana shows: service dependency graph (which service calls which)
Credentials: MinIO access key/secret injected via VaultStaticSecret from kv/monitoring/tempo/minio.